What if the patterns of institution network, where metadata cite all contributing institutions, can actually lead us to knowledge of what the GEOSS actually contains?
Therefore we created a graph that included institutions as well as individual authors. The optimised network layout was hard to read first but we observed several import patterns. The resulting graph shown impressive collaborative network with less than 100 institutions not connected to anyone else.
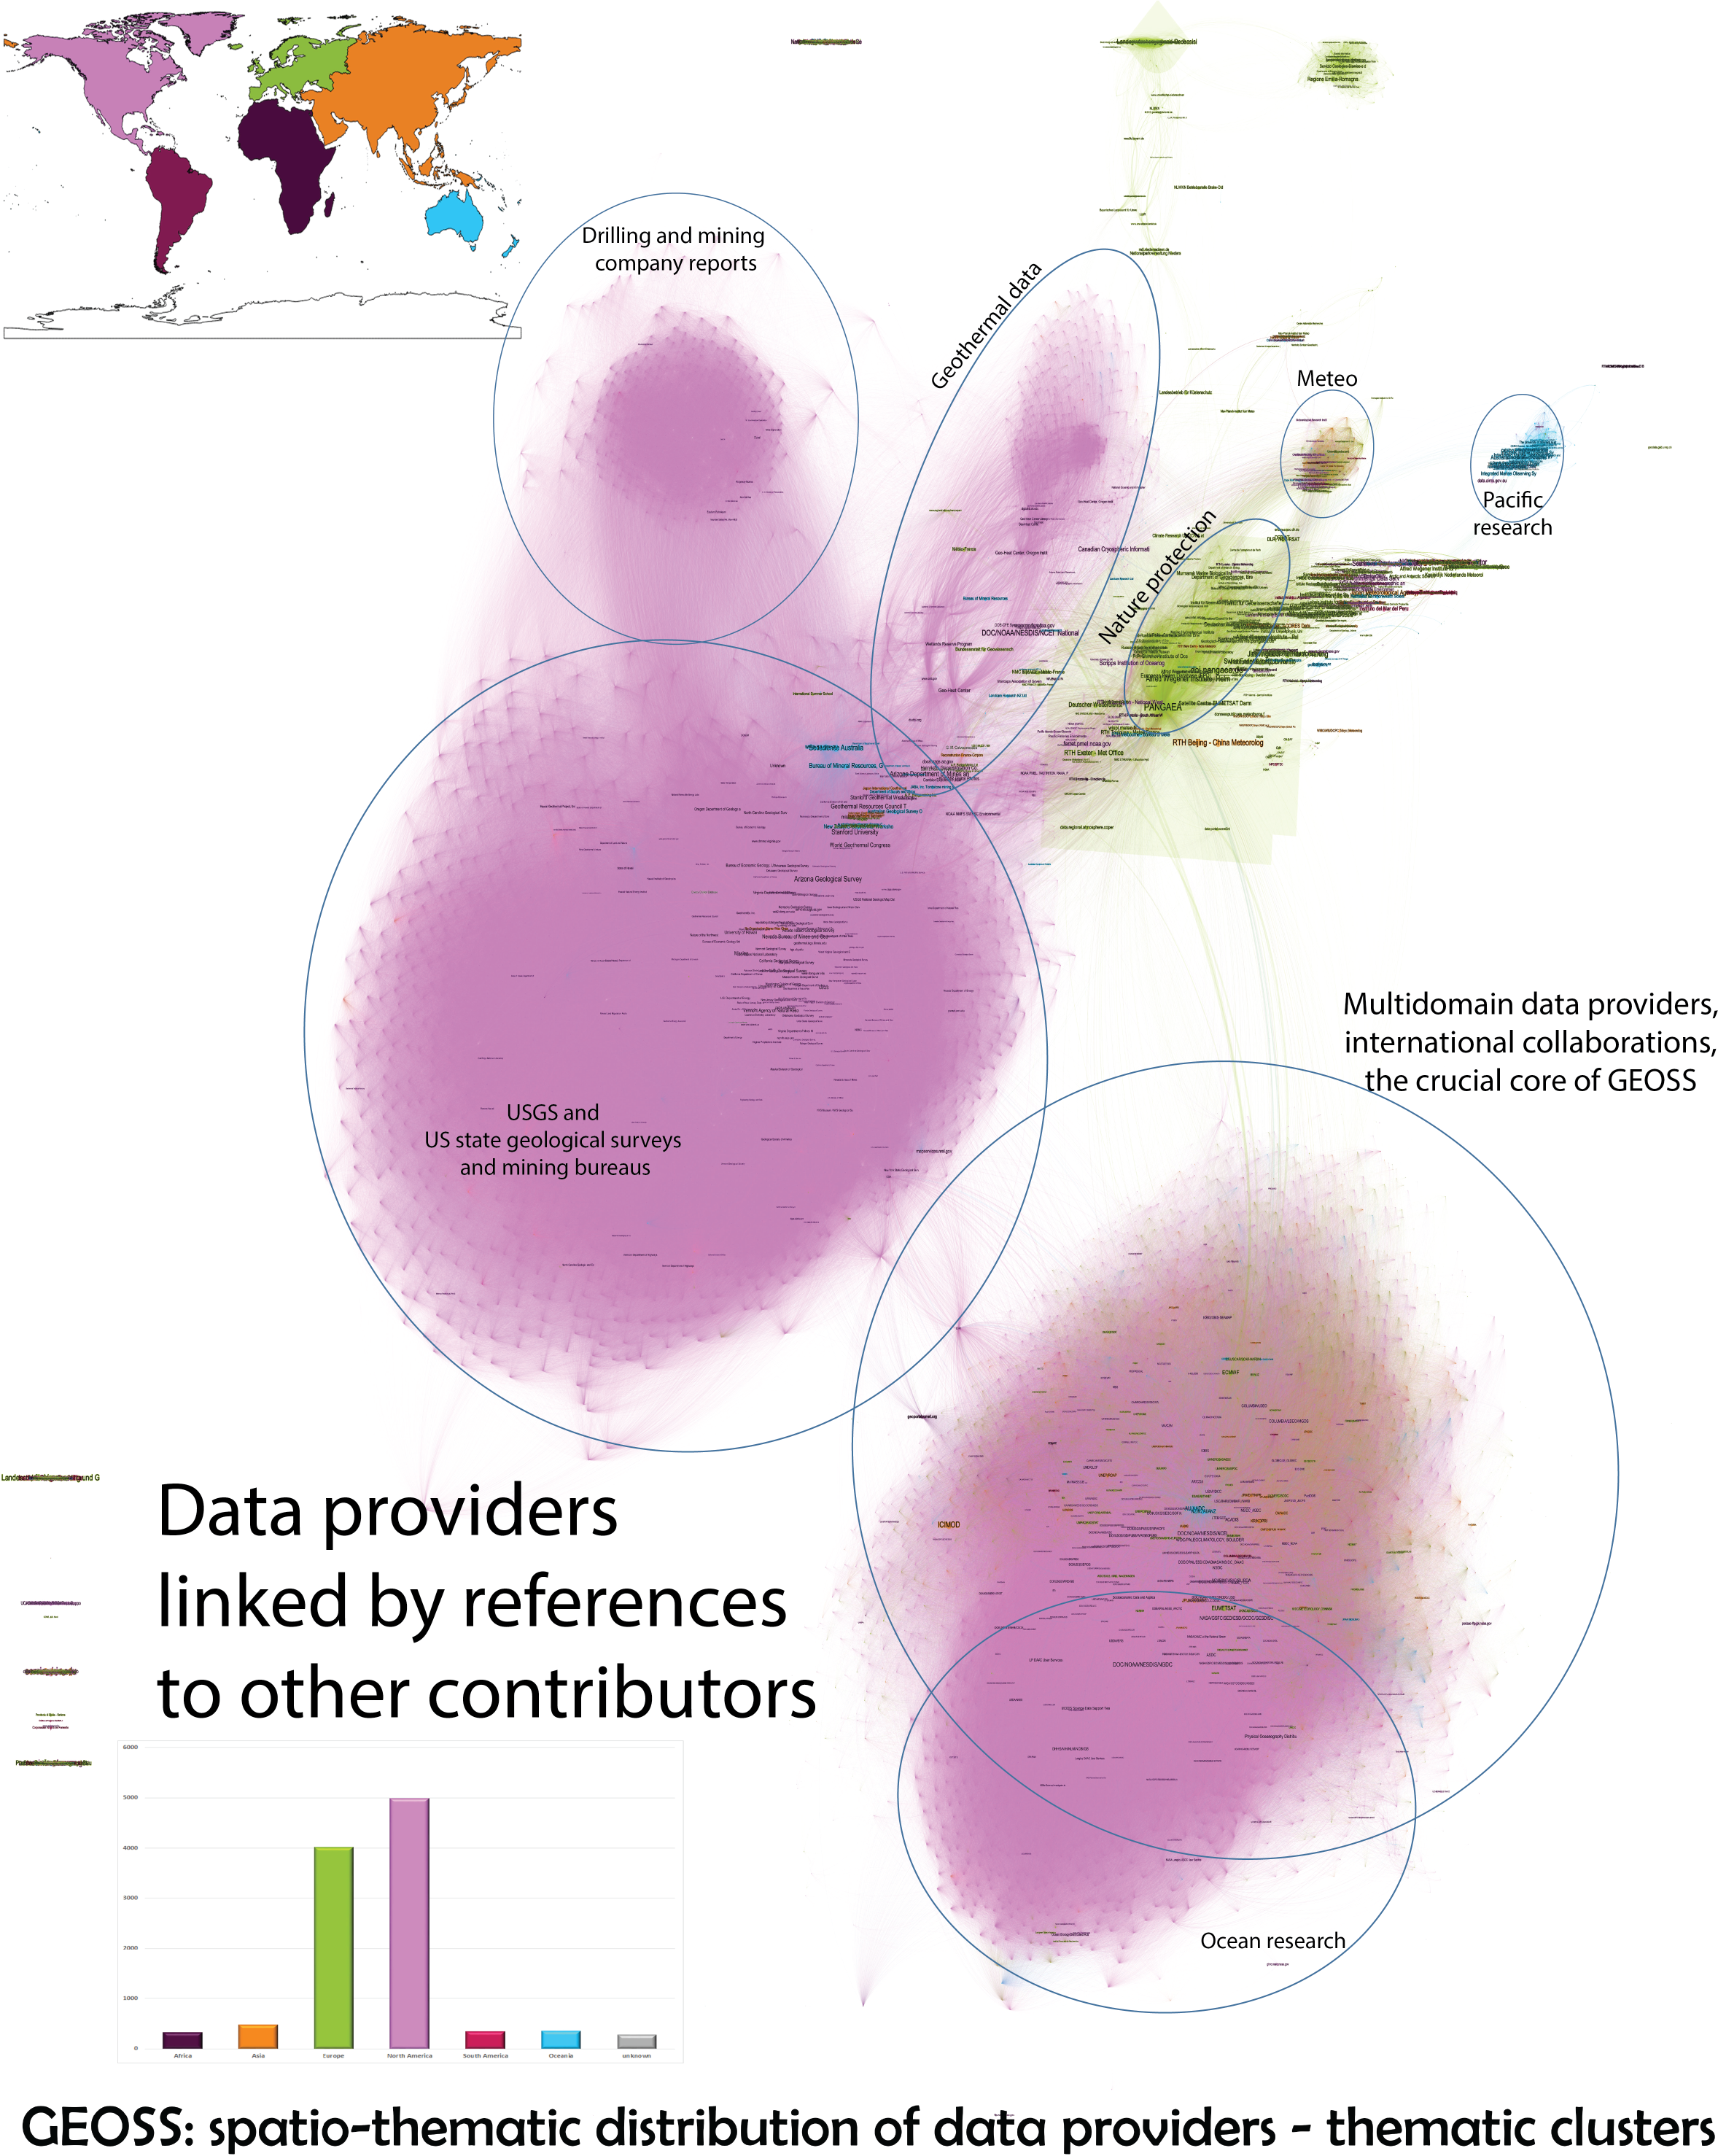
- Data providers practically clustered into five clearly identifiable groups:
- US mining and geology. USGS, the state mining authorities and US universities have created the visually most prominent cluster of institutions. The reasons for this situation are:
- The related metadata records contain people as authors / contributors which blows up the number of nodes and links in the graph.
- This cluster also demonstrates how linked are the US universities with large research and commercial projects.
- US mining and geology. USGS, the state mining authorities and US universities have created the visually most prominent cluster of institutions. The reasons for this situation are:
- The drilling companies reports metadata have been published alongside research and authoritative government without any signal
- There is a strong geothermal community in the US with prominent node of Stanford University, the Geo-Heat Center and World Geothermal Congress.
- At the right bottom we can find network of hyper-connected international institutions such as UN institutions, US governmental bodies, EUMETSAT, ECMWF, ICIMOD, etc.
ESRI and geoportal.rcmrd.org are connecting cluster a, ECMWF connects cluster c. At the bottom there is a cluster of ocean data. The vast array of connections to the international institutions validates the importance of ocean data. - Nature protection, mostly from non-US sources, due to limited use of keywords and citations. The cluster also links to tightly knitted cluster of German nature protection organisations.
- Pacific research mostly lead by Australian and New Zealand’s institutions.
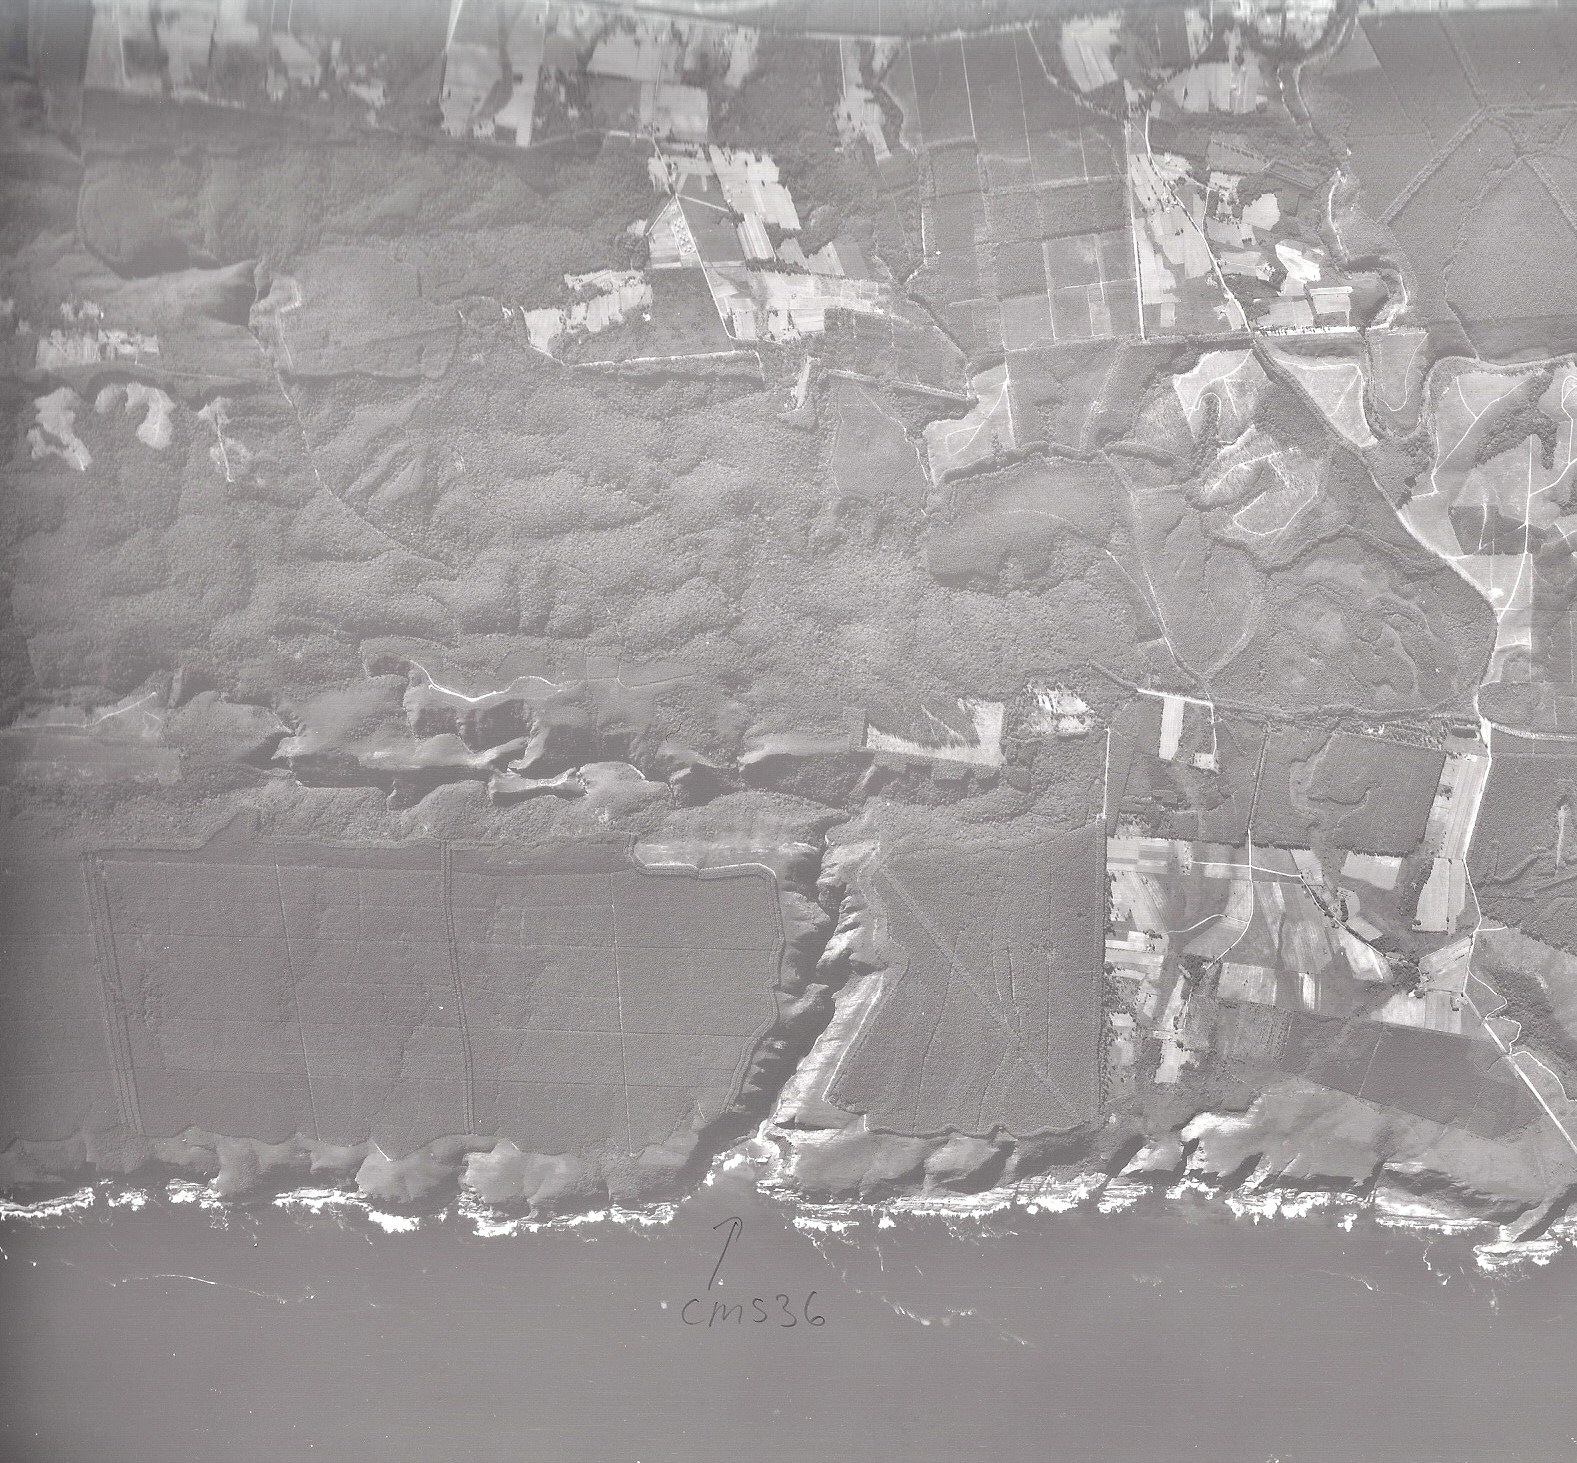
- South African Environmental Observation Network has used this field for links to their individual orthophotographs (g. http://app01.saeon.ac.za/saeis/SAEDArchive/Images/Aerial Photographs/CMS 1 – 50/Elands/Elands 1971.jpg). Therefore these values were not included.
- This graph shows how institutions collaborate, individual and group strategies to cataloguing and data collection. It is the best were able to achieve to understand GEOSS institutional structure without any supervision or domain knowledge.